Urban and Regional Development
The digital revolution and rising internet penetration across different continents continue to increase the degree of citizens’ digital connectivity, which provide more opportunities to observe and analyse behavioural patterns, especially in urban areas. Data-driven City and Smart City are the names of a few emerging phenomena that seek to leverage new types of data, innovations and the latest technologies to better understand the dynamics within urban communities to design and develop cities that are both sustainable and resilient.
The sixth Research Dive hopes to make a meaningful contribution in this areas, by enhancing the familiarity of researchers with several related datasets, including news and social media data, geospatial data, official statistics, among others. Throughout the three-day sprint, useful insights on clean water access, energy consumption, health, and regional development are expected to be uncovered. The event is taken place on 25-28 March 2018 at Pulse Lab Jakarta.
The participants are grouped into four research teams, focusing on:
- Task 1 - Designing regional development policy by analysing social events, news media data and its network from GDELT platform
- Task 2 - Assessing the accessibility to (emergency) health facilities in Sumatra, by analysing multiple sources of data, such as transportation infrastructure distribution and health facility locations
- Task 3 - Monitoring clean water access for water supply infrastructure planning
- Task 4 - Inferring energy consumption towards urban development by combining social media activity density and socio-economics statistics
The information package of the sixth Research Dive is accessible here.
Advisors
| Ibnu Syabri | Insitut Teknologi Bandung |
| Hendricus Andy Simarmata | Universitas Indonesia |
| Lusi Susanti | Universitas Andalas |
Participants
Group 1 – Designing regional development policy by analysing social events, news media data and its network from GDELT platform
| Adiwan Fahlan Aritenang | Institut Teknologi Bandung |
| Guntur Budi Herwanto | Universitas Gadjah Mada |
| Novri Suhermi | Institut Teknologi Sepuluh Nopember |
| Imaduddin Amin | Pulse Lab Jakarta |
| Mellyana Frederika | Pulse Lab Jakarta |
Group 2 – Assessing the accessibility to (emergency) health facilities in Sumatra, by analysing multiple sources of data, such as transportation infrastructure distribution and health facility locations
| Febri Wicaksono | Sekolah Tinggi Ilmu Statistik |
| Seng Hansun | Universitas Multimedia Nusantara |
| Putu Perdana Kusuma Wiguna | Universitas Udayana |
| George Hodge | Pulse Lab Jakarta |
| Muhammad Rheza | Pulse Lab Jakarta |
Group 3 – Monitoring clean water access for water supply infrastructure planning
| Ivan Taslim | Universitas Muhammadiyah Gorontalo |
| Ahmad Komarulzaman | Universitas Padjadjaran |
| Muhammad Pramulya | Universitas Tanjungpura |
| Awan Diga Aristo | Pulse Lab Jakarta |
| Rajius Idzalika | Pulse Lab Jakarta |
Group 4 – Inferring energy consumption towards urban development by combining social media activity density and socio-economics statistics
| Dwi Martiana Wati | Universitas Jember |
| Dharma Aryani | Politeknik Negeri Ujung Pandang |
| Wini Widiastuti | Badan Pusat Statistik - NTB Province |
| Pamungkas Jutta Prahara | Pulse Lab Jakarta |
| Muhammad Rizal Khaefi | Pulse Lab Jakarta |
Group 1: Shaping regional development policy through media perspective: exploring the GDELT data
Abstract
For public policy to address a problem timely and correctly, ability to respond to an actual, perceived or anticipated problem is critical. Big data holds tremendeous potential in providing information for policy analyst that is more timely, accurate and detailed. This paper examines the use of big data to shape public policy, to look on the potential of worldwide news capture in The Global Data on Event Location and Tone (GDELT) project inform policy making in Indonesia context. GDELT data sets reveal topic of interests from the following neighbourhood countries: Australia, Singapore and Malaysia on selected Indonesian big islands namely Sumatera, Kalimantan, Jawa, Bali and Papua. We concluded that big data from news play a role in shaping foreign perceptions towards specific Indonesian regions which could be responded and anticipated by policy analyst in that regions.
Result
GDELT data sets reveal real-world events in Indonesia with some limitations. GDELT data set suffers from temporal bias and captures only events with news-value. Category with the biggest number of nameset is ’kill’ and keywords such as poverty is not in the top list. Create a different category by automatically create new topics combined with domain expert input can be valuable to capture information on specific issues such as tourism, politics and human rights issues. A further study on the regional development policy can provide better context to the automatic topic.
GDELT data is rich resources on global news that provide potential new sources for national and local analysis. Issues that are important for Australia, Singapore and Malaysia newsroom on Indonesian islands can be different with national and local perspective and this can be used to understand the different perspective and to provide appropriate policy towards foreign perspective. A further study is required to understand the different perspective between national and foreign news and how that affect regional development in Indonesia context.
However, GDELT database suffers from temporal bias. To avoid implementation of inappropriate or inequitable policies, it is important to understand the extent and nature of bias in the data, and if possible correct for it. Each neighboring country has different topic of interests towards specific Indonesian island. In the past five years, Australia main interest is the Bali Nine case. Singapore is the only country of origin that reported haze events.
Group 2: Spatial Accessibility of Health Facilities in Relation to Disaster Hazards in Sumatra : Case Study in Riau Province
Abstract
Health sector is a crucial factor for the development of a country. A common problem in establishing and developing the health sector is the optimal distribution of health facilities that affect their accessibility. In this study, we focused on the analysis of spatial accessibility of health facilities in Riau Province. Moreover, we relate the health facilities location common disaster hazards in Riau Province (i.e. forest wildfire and flood). From the study, we successfully identify and classify accessibility of health facilities while taking into account the disaster hazards.
Result
Only three health facilities have very easy access and eight health facilities are classified as easy access related to disaster hazards. This also means that the majority of the health facilities are difficult to access with 80 health facilities classified as difficult to very difficult accessibility related to disaster hazards. From this study, there are also some recommendations for the Government and related stakeholders:
- The needs to improve road access to health facilities;
- The needs for more equal distributions of health facilities and infrastructures that can lead to better accessibility of
health facilities; - The importance of media to spread awareness of disaster
risks and their relationship to the location of available health facilities
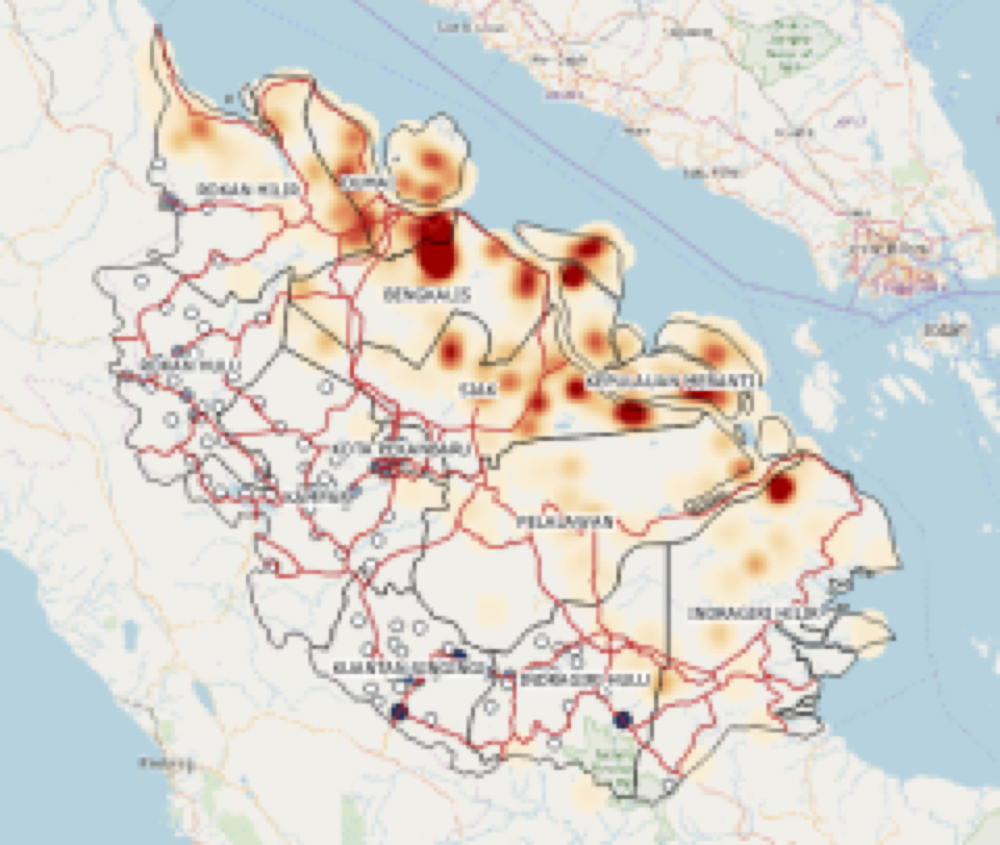
Accessibility of Health Facilities in Riau Province
Group 3: Monitoring Clean Water Access for Water Supply Infrastructure Planning in Pontianak City
Abstract
The service system of clean water network in Pontianak provided by the state water company (PDAM Tirta Jaya) in average has high coverage across the city. Yet, some parts of the community are still left behind and require attention. This study aims to reveal which part of the community receive the least service, their current coping mechanism. It also aims to identify the potential solutions that PDAM or local community might be able to consider at an a ordable cost. We utilise various datasets related to water, PDAM customer database, socio-economic background and spatial related information. Based on those, we identify that majority of low in- come households in sub-district Pontianak Utara do not have formal access to water provision by PDAM. Our nding on the behavior of non-piped water households con rms that these are the most vulnerable community and we propose an alternative solution to expand the water supply network by building a water bank using rainwater and runo especially accessible in the northern area of Pontianak City.
Result
First of all, we would like to find out the scale of water infrastructure inequality in Pontianak City by analysing state water company customer database, and if this is related to the previously identified spatial variation by BPS data. The coverage of piped water in Pontianak City is relatively high, but the services are not distributed evenly over the city. PDAM Tirta Khatulistiwa, state water supply company in Pontianak City, serves about 89% of households in the southern part of the Kapuas river, compare to 66% in the northern part. This is in line with income inequality found by BPS and our projection that Pontianak Utara is relatively less improved in key development dimensions compared to other sub-districts.
We find that households without piped water connection tend to have multiple sources of water depending on their income. Poor households mostly rely on single water source while richer households have more resources to access at least two water sources. Poor households mostly relies on dug well and others water sources (direct extraction from rivers or rain water harvesting) for drinking and bathing purposes and to a lesser extend buy refillable bottled water and vended water for drinking purpose. Meanwhile, the richer households choose better quality and relatively more expensive water sources such as branded and refillable bottled water for drinking and pump well for bathing.
 Apart from Siantan Hulu, three other villages have pipeline water access rate below 40 percents
We identify that poor households in Pontianak Utara are the most vulnerable, and at the same time most of them rely on alternative ways yet more pricey to obtain water for drinking and other households purposes. Now, the question is how can clean water access for low income households in Pontianak Utara be improved? Based on calculation we made it is known that the need for clean water at the North Pontianak sub-District (based on the total population of the area) is 14,957,400 (liter/day) or 14,957 (m3/day). The value is the basis for estimating the amount of Rainwater Harvesting (RH) that must be available to be managed to meet the water needs of the area. If it is assumed that every catchment eld used for Rainwater Har- vesting is as same wide as the Runo Harvesting Field catchment area like Embung, that serves as a Water Bank, with a minimum volume of 500 m3, then, Water needs of North Pontianak divided by Water Bank (embung) capacity volume, so it will require the installation of about 30 Water Bank unit.
Group 4: Inferring energy consumption towards urban development by combining social media activity density and socio-economics statistics
Abstract
This paper examines the energy consumption in correlation with social media activity density and socio economic statistics. By analyzing the aggregated Twitter data, the users can be classi ed into two categories, local and tourist user. Spatial mapping of district- based data has shown a signi cant correlation between Twitter activities, energy consumption and socio economics. Additionally, there was a considerable statistical relationship between Twitter activities and energy consumption as the results of Panel Data regression. A further analysis of social media activities and socio-economic statistics by using step wise regression method leads to a far-reaching statistical model to infer the energy consumption in Bali with an accuracy rate higher than 95%. The number of tourists visiting as well as the population density of each district are highly contribute to the changing pattern of electricity consumption in the province of Bali.
Result
A set of proxy data for the correlation analysis is arranged by em- ploying data from Section 3. where the Twitter users are di erently identi ed as local or tourist users based on the lifetime period of user account. An informative spatial mapping is presented in Figure 4 to provide detail information of the classi cation results of Twitter users by regency in the Province of Bali. In general, at the province level, the number of total tourist users are almost 50% higher than the total local users. Then a correlation analysis is carried out to find the relationship model between energy consumption and social media activities. It can be inferred that the number of twitter users and the frequency of tweeting activities in each regency are positively correlated with the energy consumption.
It is believed that a spatial mapping is a descriptive way to examine the energy consumption in urban area as corresponded to social media activities and the socio economic condition. The social media activities is represented by the number of overall Twitter users , while the proxy of socio economic statistic is population density. It can be analyzed that as the population density increases in an urban area, the energy consumption shows the same pattern to level up. The same relationship also appears from the perspective of social media dynamic, the denser the area, the higher energy level is needed. Interestingly, there is a situation where the population density and twitter users are low but its energy demand is higher. A simple analyses is that regency is an industrial area with most of the consumers are in industrial scales.
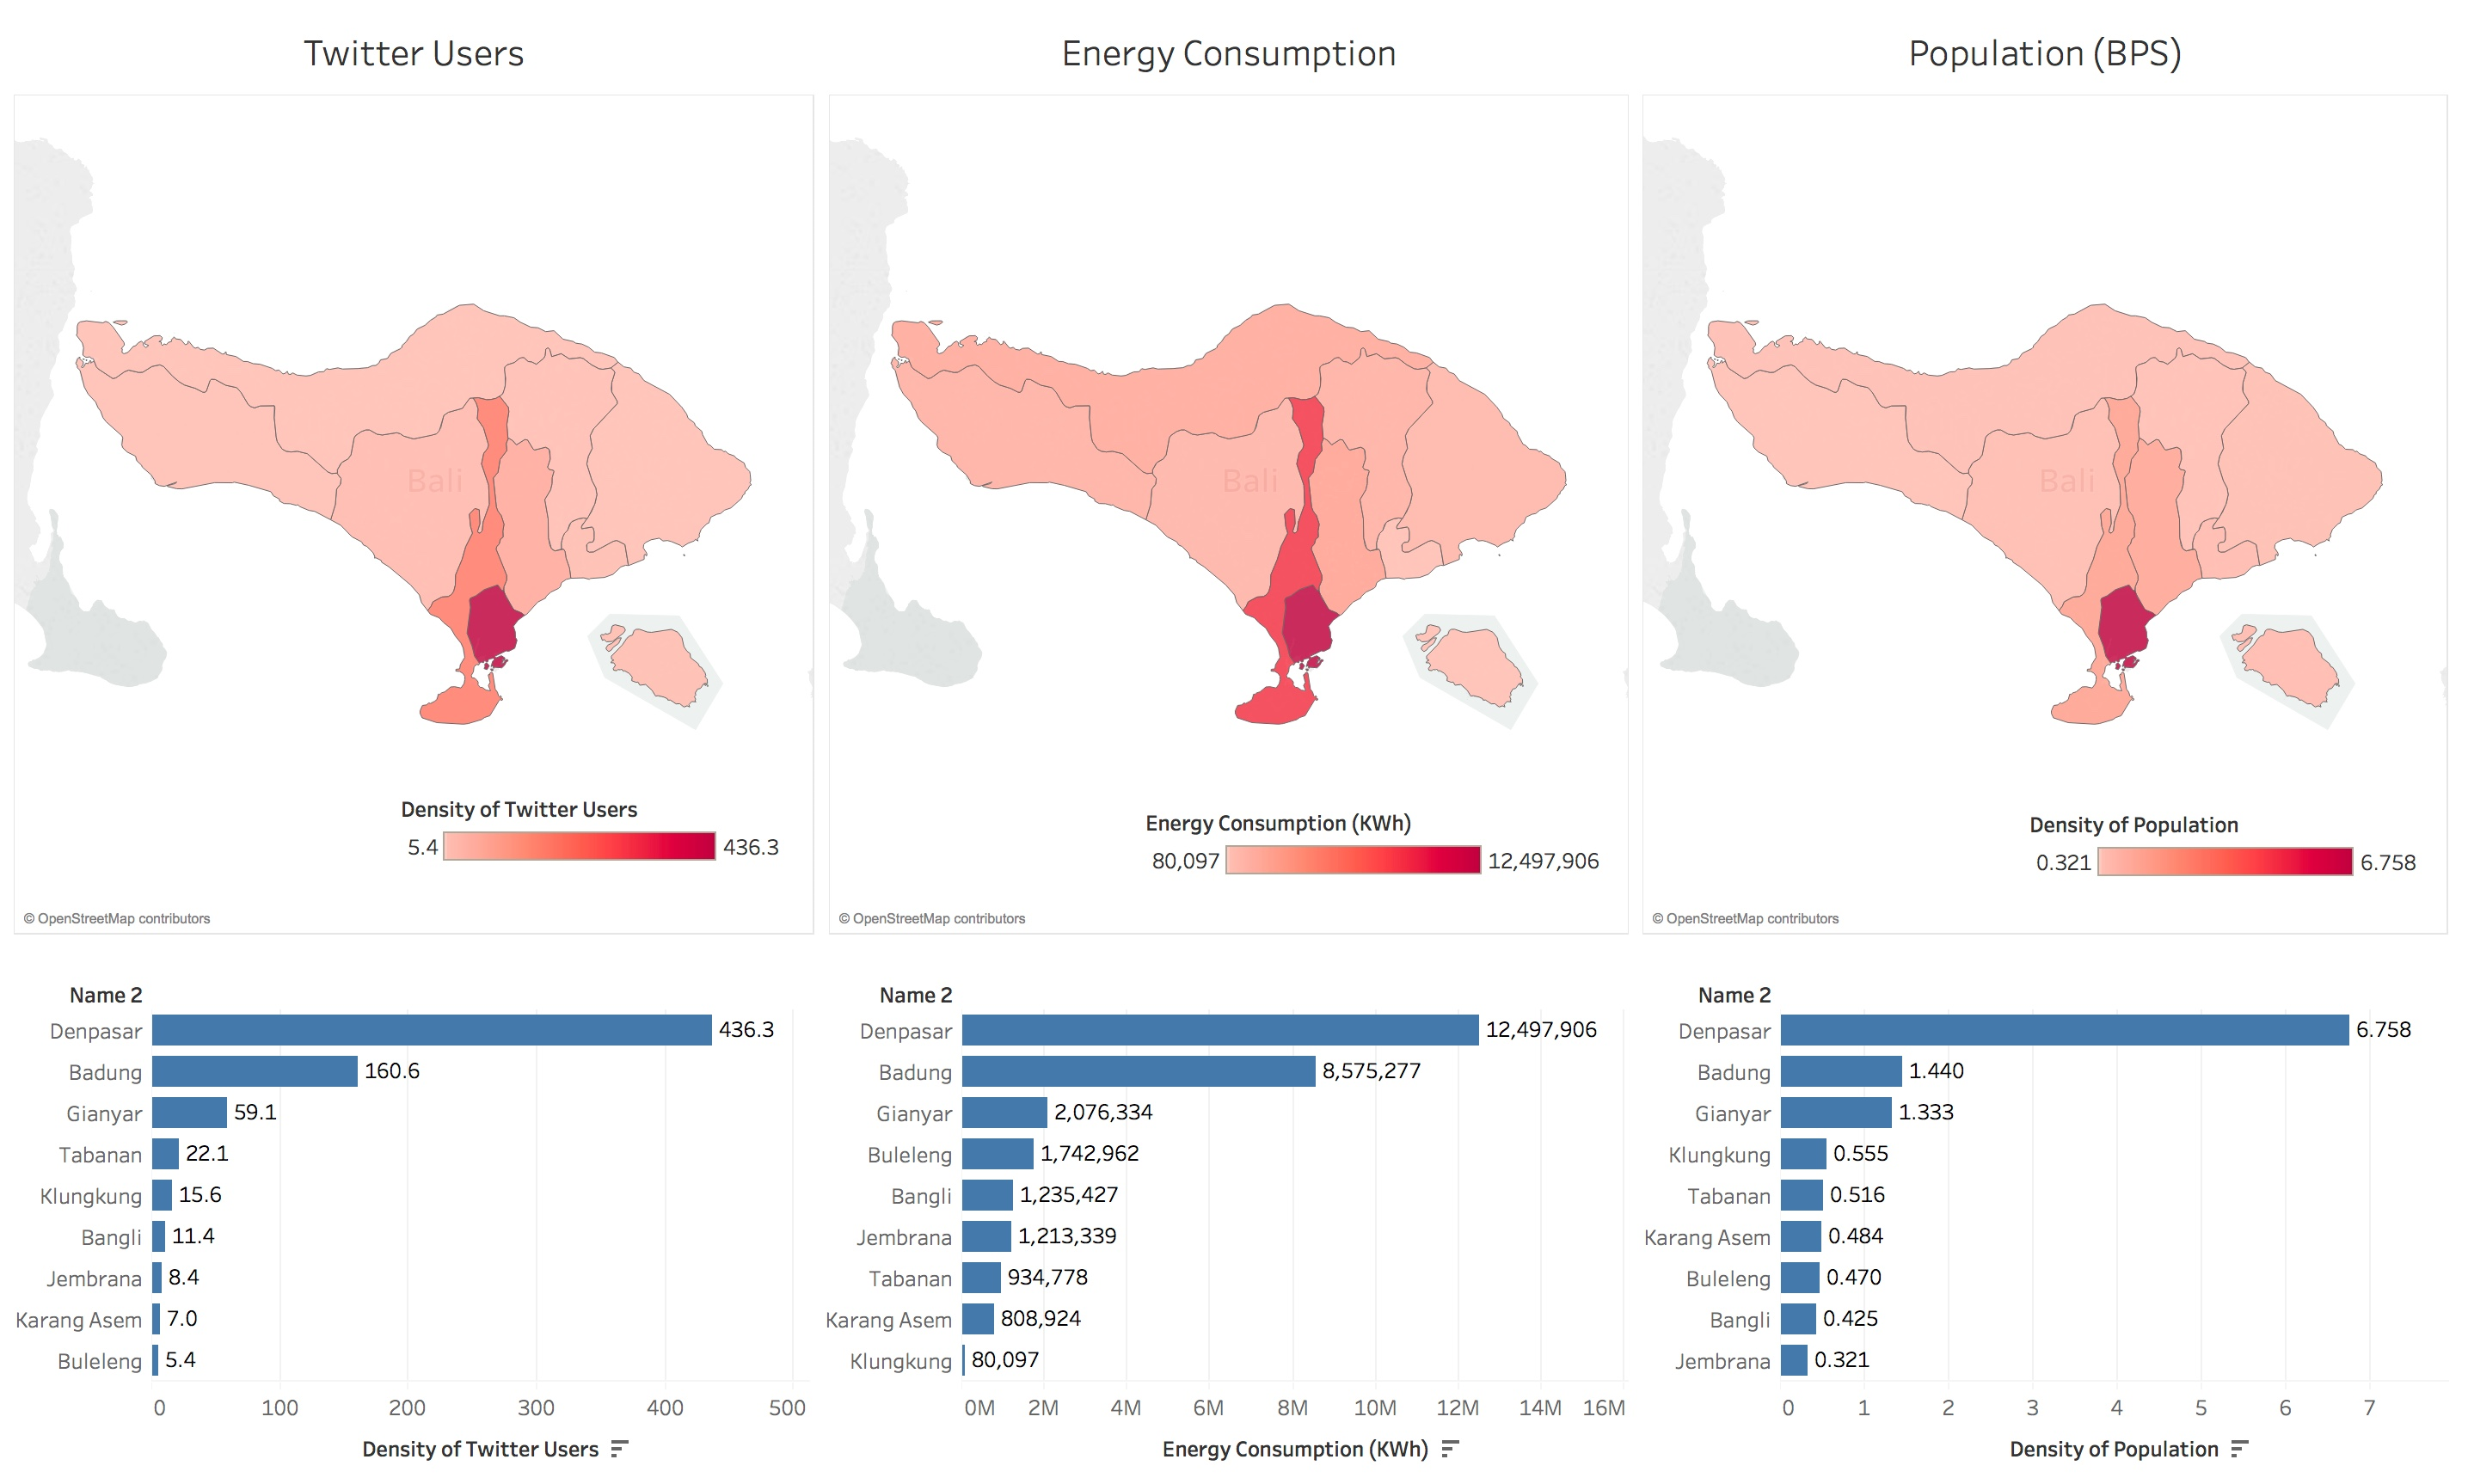
Spatial mapping of Twitter users, energy consumption, and population density
The graph shows that the overall trend of electricity consumption and population density through regencies are almost similar, when the population density is high, the energy consumption is also high. However, in Badung, the population density is just above Gianyar, but the electricity consumption is far higher. This reality is driven by condition where Badung is the center of tourism activities and accommodations which means that the energy consumption is highly correlated with the number of tourists. Furthermore, relationship between the % of poverty and the en- ergy consumption by regencies can be evaluated. It is very clear that these two variables are significantly correlate to each other in an inverse correlation. The electricity consumption decreased when the poverty level increased, this mush illustrates that the economic condition is the basic factor which determines the level of energy consumerism. The correlation coefficient between population density and the energy consumption is 0.88.
This research has proven that social media data can potentially be used to differentiate the type of user as local or tourist. By combining different type of statistical analysis , it can be clearly inferredthat energy consumption is significantly correlated with social me-dia activities and socio economic statistic. To sum up, the large number of tourists coming to Bali Island as well as the population density of each regency in the province of Bali contributed to the pattern of electricity consumption.