Statistics for Sustainable Development Goals
In the SDGs era, data becomes more essential not only to better measure the achievements of the 17 Goals but also to better implement SDGs, specifically as SDGs advise to collect 230 Indicators (even more when country specific indicators are included) for monitoring 169 Targets. Moverover, SDGs suggest to collect more disaggregated data, e.g., by gender, by age, and in subnational level. It leads the Government of Indonesia to deal with a huge data gap around the 230 indicators as well as explore many opportunities and challenges, such as new data sources (e.g., administrative data and data from private sector) and new issues (e.g., availability, accessibility, and reliability).
In order for PLJ to support the Government of Indonesia, in particular in better utilizing the existing data collection and monitoring framework in Indonesia, PLJ would like to invite statistics researchers or practitioners, who have relevant research experiences statistical problems related to SDGs, as well as hands-on skills, to analyzing 15-year MDGs indicator data in (sub-) national level.
The participants were grouped into five research teams, focusing on:
- Group 1 - Identifying correlation structures within and between MDGs Goals
- Group 2 - The Impact of Health and Education on Poverty Reduction: A Causal Analysis
- Group 3 - Safe and Affordable Drinking Water for All: A Development of a SDGs Proxy Indicator from MDGs Indicators
- Group 4 - Ensuring the Quality of Data: No Accessibility to Raw Data
- Group 5 - Spatial Disaggregation of MDGs Indicator with Numerical Method Approach
The information package of the third Research Dive is accessible here: http://bit.ly/infopackage-RD3
Group 1: Identifying correlation structures within and between MDGs Goals
Abstract
Millenium Development Goals (MDGs) has established more than a decade ago. Evaluating the achievements of the targets means evaluating its indicators as well. The useful evaluation could be based on the exploration of the correlation structures among the indicators. This can be measured with computing their correlation values and implementing the factor and cluster analysis. The impact of the available correlation structures can be revealed through the biplot of Principal Component Analysis (PCA). Using the MDGs data of Indonesia in 2007, 2011 and 2014 at province level, we discovered that there is a correlation among the MDGs indicators and Goals. Most of the structures are inline to the target type of the MDGs indicators. Further results show that the MDGs achievements across provinces are varies through the years. However, Papua, Papua Barat and Nusa Tenggara Timur are remained as the least achiever than other provinces.
Result
Statistical methods, such as factor and clustering analysis can be used to discover the correlation structures among variables with complexity. We have investigated the correlation structures among the MDGs indicators and discover some structures on them. Mostly, the structures are inline with the MDGs indicators target type.
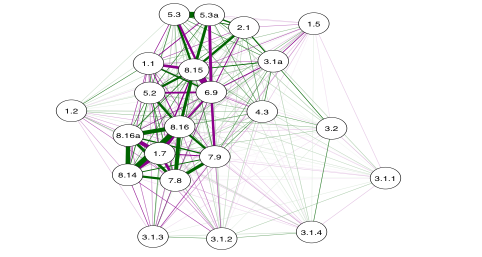
Correlation structures among MDGs indicators in 2014 data set
Biplot PCA shows that in general there are no provinces in Indonesia have exceeded the MDGs target. There are 5 provinces which can be categorized as best MDGs target’s achievement, namely: DKI, DIY, Kepulauan Riau, Kaltim and Bali since 2007, while the prominent provinces which can be categorized as least MDGs targets achievement are NTT, Maluku, Papua and Papua Barat.
Further study with different statistical analysis methods, such as SEM, path and longitudinal analysis can be conducted to find a comprehensive functional relationship within and between MDGs goals.
Group 2: The Impact of Health and Education on Poverty Reduction: A Causal Analysis
Abstract
The complexity of the relationships between the variables of interest and in some circumstances access to improved drinking water sources, access to improved sanitation facilities, enrollment in primary education, and improved literacy can impact upon income poverty, although at different timescales. It is evidence of this causal link in the context of Indonesia that the authors of this paper propose to investigate. Firstly, this research aims to confirm whether education and health give impact on poverty reduction. Secondly, its objective is to determine which indicators have the greater influence on poverty reduction. In addition, this research also identifies whether the impact of education and health change over time and space in reducing poverty.
Result
There are impacts of education and health on poverty reduction. In 2011, literacy rate and sustainable access to basic sanitation estimation are considered to give a significant impact on poverty reduction. In 2012, sustainable access to basic sanitation and education enrollment determine poverty reduction; whereas, in 2013, all indicator of health and education status are included into the model.

The Result of Estimator Parameter of Multiple Regression Model with R2 and F value
Estimated models suggest that reducing poverty can be carried out by implementing policy in education and health sectors. Moreover, spatial effect is statistically significant. It indicates that local specific policy would be needed given that there are differences on the infrastructure of health and education between regions. The magnitude of estimates show that more effort should be put in regencies, compared to cities, in order to reduce poverty in the regions.
Group 3: Safe and Affordable Drinking Water for All: A Development of a SDGs Proxy Indicator from MDGs Indicators
Abstract
The SDGs as the successor of MDGs program designs a universal holistic framework toward sustainable development. There are many new indicators in SDGs that are not supported by the available data as measured in MDGs. Some of these new indicators are very expensive to be collected. Therefore, the proxy model for this SDGs indicator with predictors from MDGs indicator is required. The indicator as a focus in this research is safely managed drinking water services. Due to the very small sample size of the available data, this work employed bootstrap on M-estimate regression. As the result, this paper gives the prediction of SDGs indicator, the percentage of safely managed drinking water services, for each district and city in Yogyakarta province.
Result
The pilot project about the safe drinking water was done in Yogyakarta in 2015. There are 940 household surveyed as smallest unit sampling. However, there are only five data corresponding to each district and city that comply with the indicator requested. Such small sample size becomes a problem to obtain valid estimation of the proxy model. This work employed bootstrap on M-estimate regression in order to obtain the more accurate estimate based on replication of sample at hand.
As the result, this paper gives the prediction of SDGs indicator, i.e. percentage of safely managed drinking water services, for each district and city in Yogyakarta province. The proposed method resulted in about 13.60% of error in prediction which quite reasonable compared with the small sample size. The method described in this manuscript can be improved further in two ways, by improving the statistical methods used or by doing more intensive research on predictor selection as inputs in proxy model.
Group 4: Ensuring the Quality of Data: No Accessibility to Raw Data
Abstract
In this paper, we proposed the method to ensure the data quality when we are not accessibility to the raw data. This method includes checking the completeness the data and does the data validation. In validation data step, the more challenging way is not only to use the internal data but also use the external/ proxy data to ensure the data quality. The methodology was implemented use the MDGs dataset, Indonesia. The result indicated that there is a positive indication we can ensure the quality of the data although we do not have access to raw data. Because of the assumption and the heterogeneity of characteristics of the data, every approach only conducts for the specific indicators in specific provinces. In validation the data using external/proxy data by grouping the provinces in the same islands show that the results was not ‘consistent’. There is the data in one provinces always become outliers in the islands.
Result
Overall, the results of this study indicated that there is a positive indication we can ensure the quality of the data although we do not have access to raw data. Because of the assumption and the heterogeneity of characteristics of the data, every approach only conducts for the specific indicators in specific provinces. Our example to validate the data using external/proxy data by grouping the provinces in the same islands show that the results was not ‘consistent’. There is the data in one provinces always become outliers in the islands. We have not found the fix method for automatic decision making for the validation of the data using external/proxy data. We still need to find the method to model threshold/confident level, especially if the dataset has minimum cases/record. Furthermore, we also need to find the method for decision making for data validation. For instance, if the data size is significant, we could consider using t-test, interval comparison, etc. The other thing, we should need to do more testing to improve the framework and methodology with more samples and ‘qualified’ data.
Group 5: Spatial Disaggregation of MDGs Indicator with Numerical Method Approach
Abstract
Detailed disaggregation for development indicators is important to ensure that everyone benefits from development and support better development-related policy making. This paper aims to explore different methods to disaggregate national employment-to-population ratio indicator to province- and city-level. Numerical approach is applied to overcome the problem of disaggregation unavailability by constructing several spatial weight matrices based on the neighborhood, Euclidean distance and correlation. These methods can potentially be used and further developed to disaggregate development indicators into lower spatial level even by several demographic characteristics.
Result
Numerical method approach can be potentially used as to estimate development indicators at lower spatial level. Further improvement needed in order to get the most suitable spatial weight matrix, since it is indeed the most crucial part in numerical method disaggregation. Another thing that is also important is finding the non-MDGs official statistics that highly correlated or have similar pattern with the respective MDGs indicator to construct initial proportion weight. This paper contributes well in proposing the methodologies of data disaggregation to monitor the achievement of development indicators at local level, and therefore, to make sure that no one left behind.
Advisors
| Ali Said | Badan Pusat Statistik (BPS) |
| Dr. Bagus Sartono | Bogor Agricultural University |
| Drs. Danardono, M.P.H., Ph.D | Gajah Mada University |
| Dr. Suhartono | Sepuluh Nopember Institute of Technology |
| Dr. Tiodora H. Siagian, M.Pop.Hum.Res | Sekolah Tinggi Ilmu Statistik |
Participants
Group 1 – Identifying correlation structures within and between MDGs Goals
| Adji Achmad Rinaldo Fernandes | Brawijaya University |
| Diaz Fitra Aksioma | Sepuluh Nopember Institute of Technology |
| Lilis Anisah | BPS of Semarang City |
| Rohmatul Fajriyah | Islamic University of Indonesia |
| Imaduddin Amin | Pulse Lab Jakarta |
Group 2 – The Impact of Health and Education on Poverty Reduction: A Causal Analysis
| Achmad Efendi | Brawijaya University |
| Kurnia Novita Sari | Institut Teknologi Bandung |
| Rina Indriani | BPS Sub-directorate Tourism Statistics |
| Yusniar Juliana Nababan | BPS of West Kalimantan Province |
| George Hodge | Pulse Lab Jakarta |
Group 3 – Safe and Affordable Drinking Water for All: A Development of a SDGs Proxy Indicator from MDGs Indicators
| Dedi Cahyono | BPS of West Papua Province |
| Dedy Dwi Prastyo | Sepuluh Nopember Institute of Technology |
| Imam Safawi | Sepuluh Nopember Institute of Technology |
| Nanang Susyanto | Gajah Mada University |
| Muhammad Rheza | Pulse Lab Jakarta |
Group 4 – Ensuring the Quality of Data: No Accessibility to Raw Data
| Budi Warsito | Diponegoro University |
| Hertina Yusnissa | BPS of West Nusa Tenggara Province |
| Marselinus Ulu F | Institute of Resource Governance and Social Change |
| Sri Astuti Thamrin | Hasanuddin University |
| Muhammad Subair | Pulse Lab Jakarta |
Group 5 – Spatial Disaggregation of MDGs Indicator with Numerical Method Approach
| Agus Mohamad Soleh | Bogor Agricultural University |
| Qurratul Aini | BPS of West Nusa Tenggara Province |
| Syarifah Diana Permai | Bina Nusantara University |
| Utriweni Mukhaiyar | Institut Teknologi Bandung |
| Ni Luh P. Satyaning Paramita | Pulse Lab Jakarta |