Image Mining for Disaster Management
What
Imagery is a type of data which contains a great value of information to enhance knowledge discovery. In developing an inclusive research, Pulse Lab Jakarta in collaboration with UN Office for the Coordination of Humanitarian Affairs (UN OCHA) Indonesia, would like to analyse image-based datasets from social media, satellites and unmanned aerial vehicles (UAV) with the eventual aim of developing tools to better manage a disaster.
Using 5400 images related to haze collected from social media, gigabytes of time-series satellite imagery capturing an active volcano pre- and post-eruption from the National Institute of Aeronautics and Space Indonesia (LAPAN) and Google Earth, as well as UAV images of the recent landslides in Garut, 16 image processing researchers and GIS enthusiast, advisors, and domain experts from 14 different universities and government research institutions collaboratively analyze the data.
The participants were grouped into four research teams, focusing on:
- Group 1 - Image classification and automatic description generation related to haze events
- Group 2 - Inference of visibility levels from images of haze in Sumatra island
- Group 3 - Quantification of the impact of volcanic eruption from satellite imagery
- Group 4 - Modelling risks and assessing hazards using the landslides in Garut as a case study
The information package of the second Research Dive is accessible here: http://bit.ly/infopackage-RD2
Group 1: Description of Images Related To Haze Crisis in Indonesia Using Deep Learning
Abstract
Image description for haze images using deep learning method is proposed in this article. The description of haze images which is obtained from the social media is a crucial information for the government, in order to give an early warning for the people about the disaster. There are two main stages applied in this article for describing the content of haze image. First, the selection of the relevant images (haze images), and second, the description of the relevant images. In the first stage, we use histogram of Hue channel as the feature, and Random Forest as the classifier. In the second stage, namely the description stage, we apply the deep learning method, which consist of Convolution Neural Network and Recurrent Neural Network. The images and annotation related to haze crisis are trained using deep learning method. The encouraging experimental results demonstrate that the proposed way to is effective in generating description of images related to haze crisis.
Result
We used 40 images as training images to generate model. Each image has two or three annotations in the form of simple sentences. The training parameters that used is batch size 100, cnn feature size 1000, embedding size 256, and 20000 iterations. In the testing phase, 4 testing images were used. These images are tested on pretrained model COCO and our trained model.
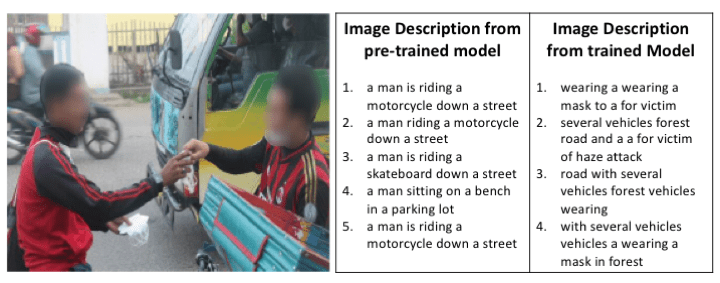 Description of the images from pre-trained and trained model
After model is trained with the image and annotation related to haze crisis, a relevant narratives that could describe the haze situation could be achieved, as shown in the figure. Unfortunately, the obtained description is not well structured as seen in the description of figure, ‘wearing a wearing a mask to a for victim’ or ‘several vehicles forest road and a a for victim of haze attack’. More training images and annotation are required to get a better model.
Group 2: Inferring the Level of Visibility from Hazy Images
Abstract
In this paper, we provide a brief survey of methods dealing with visibility level of hazy images. The methods is divided into two categories: single-image approach and learning-based approach. The survey begins with discussing single image approach. This approach is represented by visibility metric based on Contrast-to-noise ratio (CNR) and similarity index between hazy image and its dehazing image. This is followed by a survey of learning-based approach. We describe two contrast approaches, that is: (1) based on theoretical foundation of transmission light, combining with the depth image using new deep learning method, (2) based on black-box method by employing convolutional neural networks (CNN) on hazy images and their visual evaluation. We also provide experiments of the representative methods based on social media dataset and comparing the results to visual evaluation of the dataset. This survey is our first attempt to estimate visibility level from social media images.
Result
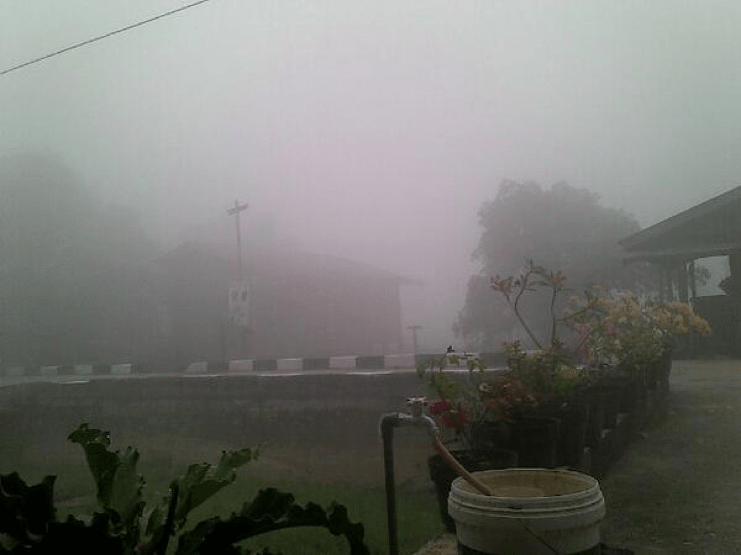
We managed to have experiment on several approaches including visibility metric (VM), structural similarity (SSIM), the depth map + dark channel prior (DCNF+DCP), and convolutional neural network (CNN). Based on correlation coefficient, the DCNF + DCP approach gives most promising result, reaching 66% comparing to human expert evaluation. The result of running DCNF on Pulse Lab hazy images dataset can be seen in figure below. The heat map should be corresponding to the distance between the objects on the images and the camera. As we can see from the figure, the depth map has troubled inferring the depth of the sky and heavy haze-covered objects. Then, we calculate haze level k using equation from the estimated depth map and transmission matrix.
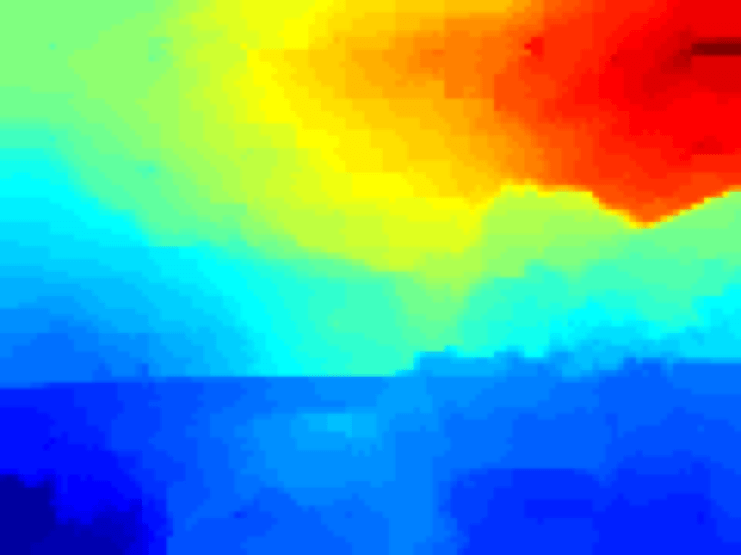
Result of DCNF show the original images and the corresponding depth map (k = 0.029282)
Due to the unavailability of ground truth depth map for Pulse Lab dataset, we cannot train the DCNF to predict the depth from the provided dataset. Moreover, the dataset contains various filtered processing and low-resolution images, that the visibility level model is incorrectly estimated. The DCNF should be trained on social media images i.e. Pulse Lab dataset to be able to model the variability of image resolution and quality. The problem is the depth information of the dataset is not readily available. The other approaches (VM, SSIM) seems only suitable for just well-behaved image dataset, and not to fit for ill-behaved social media image dataset.
Group 3: Quantifying The Impact of a Volcano Eruption
Abstract
In this research, we try to quantify the impact of a volcano eruption using spatial data and time-series images captured from satellite imagery data with Merapi volcano as case study. We divide the task into two parts. First, a macro analysis approach to prioritize area using spatial data. Second, we quantify the number of damage and recovery part using image processing approach. By using the spatial data, we are able to detect the distribution of the impact of the eruption as well as areas that have been recovered after the eruption on a broad scale and by using the image processing approach we are able to identify the land-use changes as well as quantify the number of damage such as the sand river expansion and the number of destroyed and recovered building.
Result
To identify the impact of the eruption on this research can be done by performing numerical calculations on land cover data that has been given a unique pixel value. Changes in land cover due to volcanic eruption may be identified by several factors such as changes in the vegetation into the open area. Then, numerical method is used by subtracting the data before the eruption to the data after the eruption in order to obtain the classification of negative values is assumed to be the area affected by volcanic or by humans. The results of the analysis of the impact of the eruption is shown by the following figure.
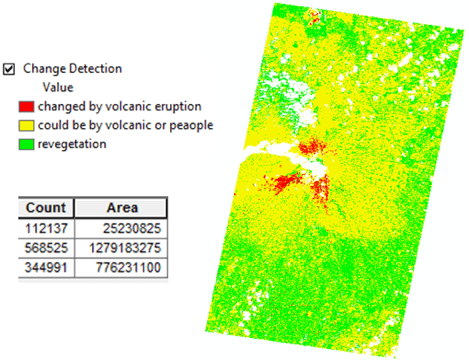 Detection of the impact of eruption based on ASTER data before to the when eruption
We also tried to quantify impact using image processing approach to detail analyze the un-georeferenced imagery from Google Earth. This tracks aims to give an information to authority about the land-use changes in number such as the area and number of damaged building. We calculated two main impact caused by a volcano eruption such as a) the sand river expansion and b) number of building before the eruption and current situation.
Group 4: Physical Vulnerability Modeling Based On Flood Inundation Model and Image Mining
Abstract
Flash flood disaster occurred within the City of Garut, West Java, Indonesia, on 20th September 2016, which caused many casualties and damages. Flood model could be performed to model the already-occurring disaster, as well as to depict future events that may occur to overcome any potential disasters, where the inundation flood model depicted the element at risk. In order to assist the analysis for the damages occurred, image mining could be used as part of the approach, where online media was utilized as well. The image mining resulted information about building damages caused by the flood. Afterwards, the physical vulnerability (buildings/residents) model could be further performed. Finally, the relationship between vulnerability and the flood inundation were portrayed. The resulted physical vulnerability model showed that larger height of the flood water caused higher degree of loss of the building, in which portrayed the need for total rebuild of houses as well. Considering available open source data and fast data acquisition, the approach showed such efficient approaches, where the results could be used in order to establish recommendation for building reinforcement, spatial planning, or protection wall in flood prone areas within the future time.
Result
Considering available open source data and fast data acquisition, the study showed that that inundation model and image mining is one of such efficient approaches to depict the correlation between damage level of physical features (buildings/residents) and the flood inundation (velocity and depth) of the already-occurring flood disaster and potential future events. Using coordinate information refer to geolocation obtained from social media images, each level of building damage can be mapped to see the distribution of the damage. Overlay distribution of damage map and the expansion of the inundation can be analyzed, showing the spatial impact of the flood occurring to the building as shown in figure below.
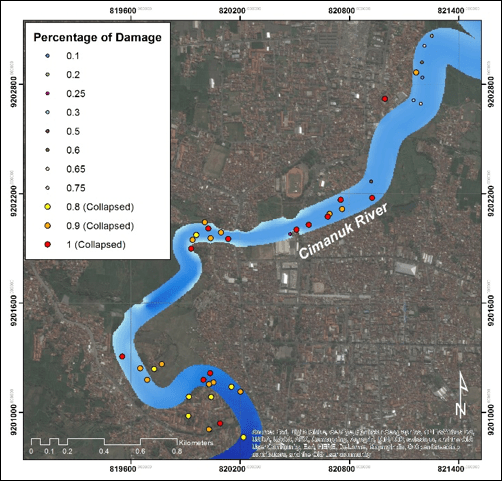
Spatial depiction of the damaged residents
The resulted physical vulnerability model showed that larger height of the flood water caused higher degree of loss of the building, where it portrayed the need for total rebuild of houses as well. The results could be used in order to make recommendations for building reinforcement, spatial planning, or protection wall in flood prone areas within the future time.
Advisors
| Dr. Eng. Anto Satriyo Nugroho | Badan Pengkajian dan Penerapan Teknologi |
| Trias Aditya K. M., ST, M.Sc, Ph.D | Gajah Mada University |
| Dr. Ir. Agus Wibowo, M.Sc | Badan Nasional Penanggulangan Bencana |
| Faizal Thamrin | United Nations Office for the Coordination of Humanitarian Affairs |
Participants
Group 1 – Description of Images Related to Haze Crisis in Indonesia Using Deep Learning
| Ema Rachmawati | Telkom University |
| Indah Agustien Siradjuddin | Trunojoyo University |
| Muhammad Dwisnanto Putro | Sam Ratulangi University |
| Vina Ayumi | University of Indonesia |
| Ni Luh Putu Satyaning Paramita | Pulse Lab Jakarta |
Group 2 – Inferring the Level of Visibility from Hazy Images
| Alexander A S Gunawan | Bina Nusantara University |
| Heri Prasetyo | Sebelas Maret University |
| Indah Werdiningsih | Airlangga University |
| Janson Hendryli | Tarumanegara University |
| Muhammad Rheza | Pulse Lab Jakarta |
Group 3 – Quantifying The Impact of a Volcano Eruption
| Dina Chahyati | University of Indonesia |
| I Dewa Nyoman Nurweda Putra | Udayana University |
| I Gede Boy Darmawan | Lampung University |
| Iis Hamsir Ayub Wahab | Khairun University |
| Imaduddin Amin | Pulse Lab Jakarta |
Group 4 – Physical Vulnerability Modeling Based On Flood Inundation Model and Image Mining
| Edy Irwansyah | Bina Nusantara University |
| Guruh Samodra | Gajah Mada University |
| Hendra Pachri | Hasanuddin University |
| Maulana Ibrahim Rau | Bogor Agricultural University |
| Muhammad Subair | Pulse Lab Jakarta |